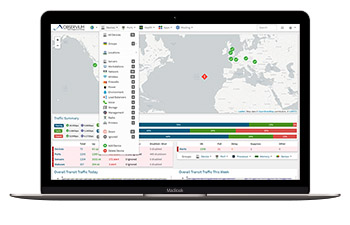
Observium is a network monitoring and management platform that provides real-time insight into network health and performance. It can automatically discover network devices and services, collect performance metrics, and generate alerts when problems are detected.
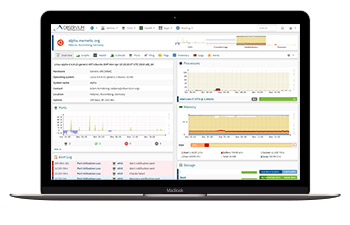
Observium includes a web-based interface that allows users to view network status and performance metrics in real time, as well as historical data. It is designed to be easy to use and maintain, with a focus on providing the information that network administrators need to quickly identify and resolve issues
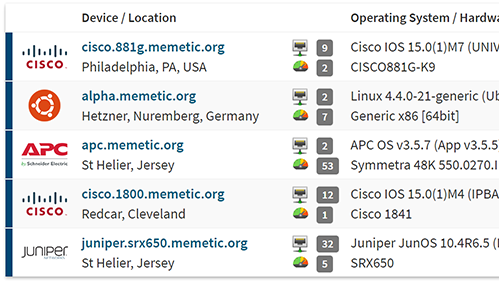
Observium supports a wide range of device types, platforms and operating systems including Cisco, Windows, Linux, HP, Juniper, Dell, FreeBSD, Brocade, Netscaler, NetApp and many more.
Professionally developed and maintained by a team of experienced network engineers and systems administrators, Observium is a platform designed and built by its users.
Observium improves the visibility of your network infrastructure by automatically collecting and displaying information about services and protocols you may not otherwise monitor.
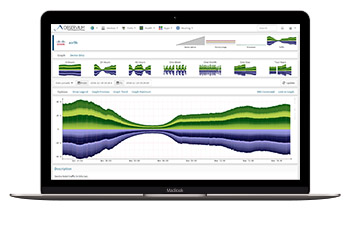
Observium helps to streamline capacity and disaster recovery planning by providing long term network metric collection and intuitive visual representations of collected performance data.
Observium improves your network's reliability by providing you with the information to proactively respond to a greater number of potential issues before they become service impacting.
Observium Professional and Enterprise are distributed via an SVN-based release mechanism, providing rapid access to daily security and bug fixes as well as new features. A summary of fixes and improvements can be found in the Changelog.
Observium Enterprise is intended for deployments requiring additional support and includes 10 hours of support time and priority consideration for new features.
Observium Community is distributed via 6-monthly .tar.gz releases under the QPL Open Source license. The most recent release is 24.04 (29th April 2024) based on revision 13528. It is a major update to the previous version, with 525 commits since the previous version.
The Community Edition receives updates and new features on a 12 to 6-monthly release cycle and is best for small non-critical deployments, home use, evaluation or lab environments. Follow the instructions in our documentation for upgrades and installation.
Observium Professional Edition subscriptions are available free of charge to registered charities and Open Source projects.
Community Ideal for home labs Free |
Professional Ideal for SME and ISPs £200 / yr |
Enterprise Ideal for large Enterprises £1000 / yr |
|
---|---|---|---|
Realtime software updates and fixes | |||
Twice-yearly releases | |||
Number of monitored devices, ports and sensors | Unlimited | Unlimited | Unlimited |
Full autodiscovery of supported devices and metrics | |||
Network mapping through discovery protocols | |||
Rule-based automatic grouping | |||
Threshold, State and Syslog Alerting | |||
Traffic accounting system | |||
IP SLA, Pseudowire and Class-based QOS metrics | |||
RESTful API | |||
Support and Services options available | |||
Ability to scale an instance across multiple servers | |||
Priority consideration of feature requests | |||
Included Enterprise-grade email & live support | 10 Hours | ||
Observium supports a wide range of devices and operating systems spanning both standard and private MIBs. Over 458 separate OS types are currently supported including autodetection and graphing of device metrics from hundreds of industry standard and private MIBs.
Support is also provided for the Alcatel AIP, Cisco CDP, Foundry FDP and LLDP discovery protocols, vendor-specific extensions to BGP4-MIB from Cisco, Force 10 and Juniper, vendor-specific MAC accounting from Cisco and Juniper and extended vendor-specific statistics collection for various load balancers, wireless access points and enterprise storage systems.
The Observium development team frequently works with hardware vendors to extend and test support for new devices.
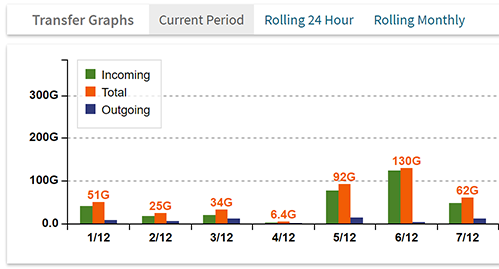
Traffic Accounting is a feature available in the Professional Edition which is designed to ease the process of tracking and billing customer bandwidth usage. It independently polls and stores measurements in its own database tables to bypass traditional round-robin limitations. It can be run at different intervals to the primary Observium poller allowing accounting to be based on intervals other than the default 5 minutes.
Accounting by both total transferred data and 95th percentile is supported.
Observium supports integration with a number of third party applications and the ability to write your own custom application modules to collect and report data from your applications.
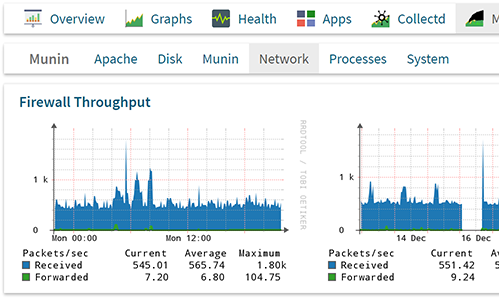
Integration exists for collectd, munin, smokeping and RANCID, allowing you to view metrics and configuration data collected by these tools within the Observium interface, helping to streamline diagnostics and day to day operations.
Supplied application collectors include Apache, BIND, DRBD, Memcached, MySQL, NFS and others.
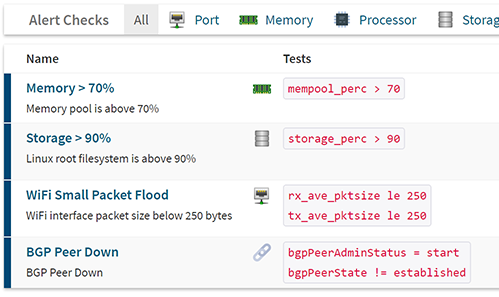
Observium's threshold alerting system allows you to configure thresholds and failure states for a wide range of different entity types. Some types support automatic collection of thresholds from the monitored device itself.
Alerting entries are automatically created during the discovery process making sure that your alerting system is kept up to date with the configuration of your network infrastructure, helping to reduce the number of missed alerts.
Tests can be associated with devices and entities using a flexible system of association definitions rather than preset templates or manual configurations.
Observium's Professional Edition has built up a broad and extensive userbase consisting of Governments, Major Corporations, Telecommunications providers and ISPs, Small and Medium Enterprises, Non-profit Organisations and individual users.
Observium powers tens of thousands of installations monitoring millions of devices.
Notable users include: Twitch, eBay, PayPal, Aramco, Squarespace, The Scottish Government, Yahoo Inc., The Queensland Government, Spotify, CCP Games, Daily Motion, FranceIX, The US Department of Energy, eHarmony, Allied Telesis, Arista and many more.
For Managed IT companies like ours, monitoring our customers' infrastructure is critical. For years, we went through every network monitoring package we could find. We spent a lot of time and money, but we were never really happy with the results we got. When we found Observium, we were amazed by how simple the product was to configure and support. For the past two years, we've been able to sit back and allow Observium to work for us. Observium supports most of the network devices and appliances we've attempted to monitor out of the box, without any tedious configuration or cryptic programming. It automatically creates useful graphs and event logs that allow our technicians to visualize and take action on incoming data in real time. It's clear that the development team has a clear and concise vision for where they are going, and it shows in their product. I recommend Observium to anyone who is looking for a dependable, easy to use, and functional network monitoring and management product. Chad Maynard, TechOptics, Inc.
Custodian DataCentres is a provider of colocation and connectivity services, a key part of our business is the delivery of high-capacity ‘always-on’ networking across all our locations. With a wide selection of hardware platforms and a high overall port count it is essential that we collect high value statistical information in an automated manner. This huge quantity of information must then be ordered, filtered and analysed continuously; bringing only critical events to the attention of the Operations Centre team.
Observium is one of the key systems we use for this purpose, specifically for its ability to discover, collect and graph everything automatically, with almost zero engineer input. Global thresholds and alert templates are then applied to new devices as soon as they are added to our network. Providing an immediate and full view of any new devices, often before the engineers have even finished performing all the of the physical port connections. Recently we have completed a full core network upgrade across a number of our sites, and during this process Observium exceled and really came into its own; way ahead of our other systems. This was largely down to its ability to fully detect, learn and automatically generate all the monitored elements for newly deployed hardware without consuming valuable engineering time. This allows for rapid detection of ports with errors/issues or internal routing adjacencies which are down or encountering issues. Allowing the engineering team to focus on any issues, instead of spending time checking everything manually one item at a time.
Over the many years we have used Observium, it has evolved from a ‘nice little web tool’ to a core and critical element within our NOC. We find the continuous development of the product excellent and we have even added support for a couple of our more obscure devices ourselves. We look forward to continuing to work with Observium and are keen to see what the future for it holds as it and Custodian continue to grow.
Robert Williams, Technical Director, Custodian DataCentres